
- Platform

Revenue Opportunity
Quantify by page lost revenue that can be recaptured from removing friction

Real-Time Bottom of the Funnel
Visualize step-by-step conversion rates to understand customer fallout and drop-off

Cost of Broken Links
Calculate the cost impact on conversions resulting from users being directed to broken links
Domain & Page-Level Conversion Rate Curve
Identify pages where speed most impacts conversions and prioritize optimization efforts by ROI

Cost of a Tag
Calculate the cost impact on conversions for every first- and third-party tag on your site
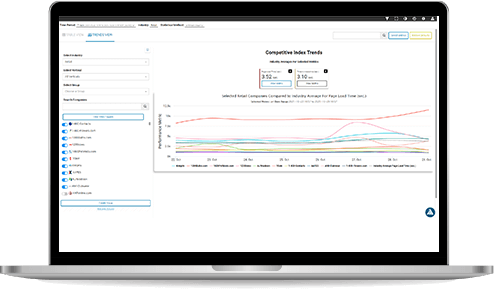
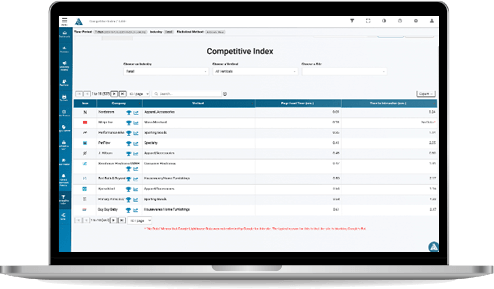
Competitive Index
Trend, group and analyze side-by-side more than 40 site performance metrics your site vs. competitors

Real-Time Customer Journey
Identify highest converting path and bottlenecks undermining campaign performance

Core Web Vitals
Identify friction points causing Google to deprioritize your site in rankings and customers to bounce prematurely

Aggregate Waterfall, Function Tracing and Website Filmstrips
Identify and address hidden JavaScript functions that cause blocking behavior and frustrate users

Conversion Rate A/B Testing
Identify pages where speed most impacts conversions and prioritize optimization efforts by ROI

Anomaly Detection for All 1st and 3rd Party Content
Identify friction caused by every piece of content on your site, to direct remediation efforts

Content Security Policy
Inventory all 1st & 3rd party domains, create a whitelist of approved domains, auto-generate and deploy your customized CSP

Revenue Attribution
Calculate actual business impact of remediation efforts vs. goals

Executive Trend Report
Visualize performance trends over time across numerous variables across your website

What Changed Report
Analyze each object to see what was added, changed or moved with side-by-side comparison views