NEW eBook: 3 Hacks to Creating Digital Experiences as Frictionless as Floating Through Space  Get your copy now 

DEM Solutions Purpose-Built for You

Solutions by

Lorem ipsum dolor sit amet, consectetur adipiscing elit. Maecenas nec lectus id justo luctus iaculis. Vivamus porta nisl eget suscipit faucibus. Donec facilisis eu ipsum ut dictum.

Industry Continuous Experience Optimization Solutions for Your Industry

graph
Mark-one

Use Case Continuous Experience Optimization Solutions for Your Needs

Team Continuous Experience Optimization Solutions for Your Role

eye

Are you leaving millions of dollars on the table by not addressing slow web pages?

Blue Triangle's proprietary Real User Monitoring (RUM) and Synthetic Monitoring is the engine that powers a powerful, predictive digital experience management platform that maps page performance to online sales, calculates the ROI at optimum page speeds, and drives revenue and boosts conversions.

bt-play-button

Are you leaving millions of dollars on the
table by
not addressing slow web pages?

Blue Triangle's proprietary Real User Monitoring (RUM) and Synthetic Monitoring is the engine that powers a powerful, predictive digital experience management platform that maps page performance to online sales, calculates the ROI at optimum page speeds, and drives revenue and boosts conversions.

Quantify How Web Performance
Impacts Your Business KPIs

Connect web performance to business metrics in one, centralized view to visualize how tolerant your customers are
to the speed of your site, down to the millisecond.

With the Blue Triangle DEM Platform, automatically identify pages where speed most impacts conversions. Locate the pages that are sensitive to site slowness to prioritize initiatives and maximize your budget to benefit from the best return on investment.

platform-laptop-one
platform-laptop-two

DEO Scoring and Anomaly Detection

The Digital Experience Overview (DEO) is the highest level dashboard in the Blue Triangle Platform. We have developed a first-rate scoring system from 0-100 for each of the Blue Triangle modules, including our proprietary Real User Monitoring and Synthetic Monitoring, Business Insights, Tag Governance, and Marketing Analytics.

The scorecard color conveniently measures the health of each indicator in relation to your configurable, site-level thresholds. Through DEO Anomaly Detection, machine learning constantly monitors your site for issues, and automatically alerts you when issues are detected.

What's Changed Report

Blue Triangle can completely reconcile a page over two periods of time to observe what has been added or removed from the site. Full page reconciliation is the Blue Triangle advantage to quantify the total impact on page performance and key metrics.

With Blue Triangle’s unique What’s Changed report, which can be generated immediately, you can confidently compare site performance over two time periods, diagnose performance issues, and pinpoint the exact domain or file causing slowness.

platform-laptop-three
platform-laptop-four

JavaScript Function Tracing

Blue Triangle’s industry-leading JavaScript Function Tracing helps website owners improve key Google page speed metrics, such as Time to Interactive (TTI), First Input Delay (FID), and First Contentful Paint (FCP).

By shining the light on long-running JavaScript tasks, which often bog down webpages and cause slowdown, you can positively impact your website’s Core Web Vitals and organic search results.

Core Web Vitals and Performance Budgets

In working with Google, Blue Triangle developed Performance Budget dashboards as an efficient way to track Core Web Vitals (CWV), which are an essential step into understanding critical aspects of the user experience.

Performance Budgets set limitations for your site metrics which affect site performance. On this page, you can specify thresholds for key site indicators and monitor their status. Learn how to set budgets and see if your site needs to go on a performance diet.

platform-laptop-five
platform-laptop-six

CrUX Reports and KPI Date Comparison Reports

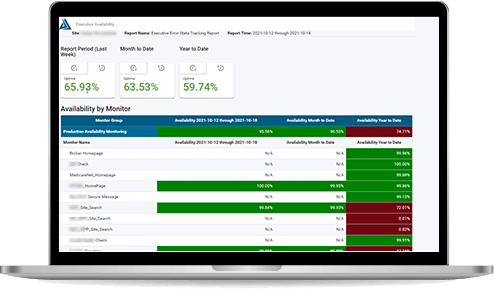
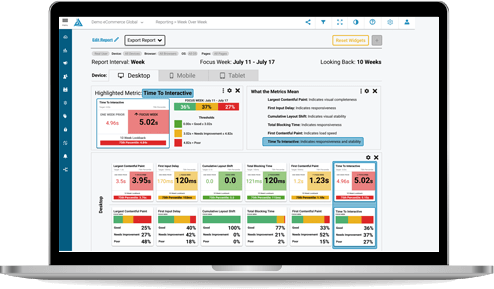
Continuous website performance monitoring is crucial to identify and predict trends before they negatively impact your customers’ digital experience and your key performance indicators. 

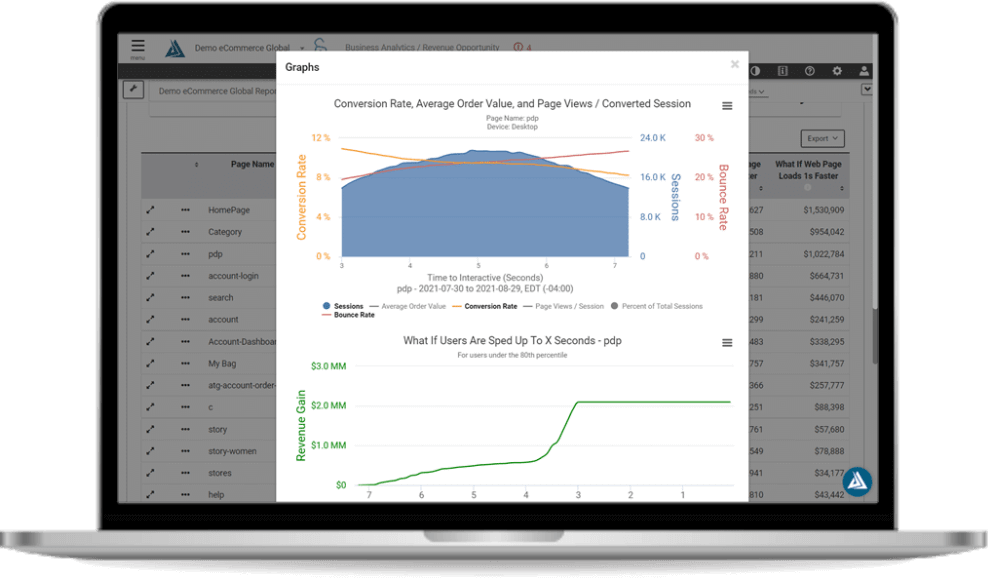
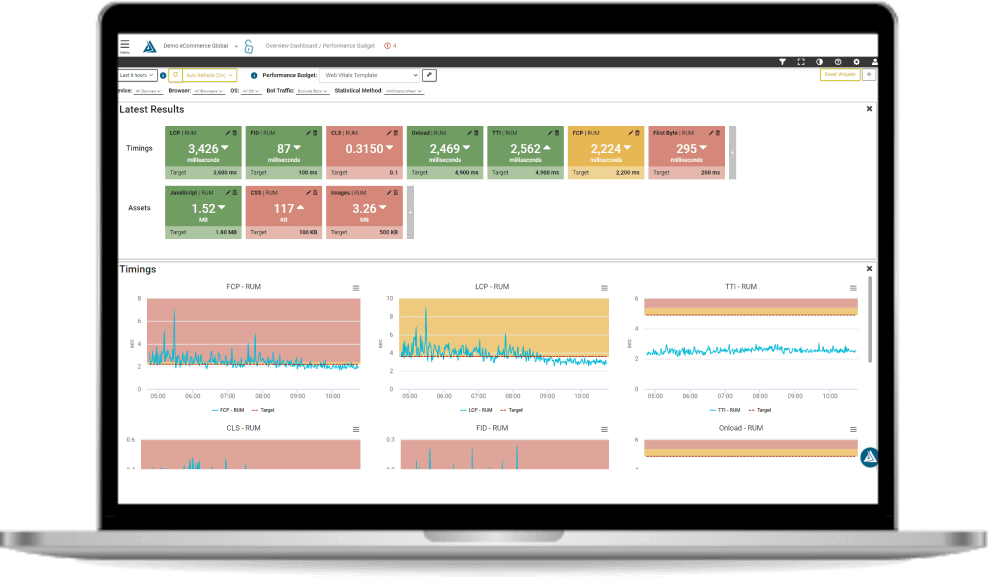
Custom CrUX and KPI reports within the Blue Triangle DEM Platform allow you to gain a real-time comparison of your key performance indicators from a baseline in the past, measure page views, visits, load time, and more. 
 

Compliance and Availability Reporting

Streamline your compliance and availability reporting to confidently satisfy your external regulatory requirements, internally established Service Level Objectives, and external Service Level Agreements.

With Blue Triangle, seamlessly gain a wholistic view of your site to track internal and external control standards in a centralized, easy to understand report.

platform-laptop-seven

Future-proof DEM Platform

Blue Triangle uniquely correlates website performance improvements to the customer experience, conversion, revenue, and better business outcomes. Our comprehensive solution places control in your hands to create great digital experiences for your customers.

Quantify

Revenue Opportunity

Quantify by page lost revenue that can be recaptured from removing friction

Filter

Real-Time Bottom of the Funnel

Visualize step-by-step conversion rates to understand customer fallout and drop-off

Cost of Broken Links

Calculate the cost impact on conversions resulting from users being directed to broken links

Filter

Domain & Page-Level Conversion Rate Curve

Identify pages where speed most impacts conversions and prioritize optimization efforts by ROI

Cost of a Tag

Calculate the cost impact on conversions for every first- and third-party tag on your site

Competitive Index

Trend, group and analyze side-by-side more than 40 site performance metrics your site vs. competitors

Resolve

Real-Time Customer Journey

Identify highest converting path and bottlenecks undermining campaign performance

Core Web Vitals

Identify friction points causing Google to deprioritize your site in rankings and customers to bounce prematurely

Aggregate Waterfall, Function Tracing and Website Filmstrips Identify and address h

Identify and address hidden JavaScript functions that cause blocking behavior and frustrate users 

Conversion Rate A/B Testing

Identify pages where speed most impacts conversions and prioritize optimization efforts by ROI

Anomaly Detection for All 1st and 3rd Party Content

Identify friction caused by every piece of content on your site, to direct remediation efforts

Content Security Policy

Inventory all 1st & 3rd party domains, create a whitelist of approved domains, auto-generate and deploy your customized CSP

Content Security Policy

Inventory all 1st & 3rd party domains, create a whitelist of approved domains, auto-generate and deploy your customized CSP

Customizable Performance Paths

Identify where friction is impacting steps in your performance path

Validate

Revenue Attribution

Calculate actual business impact of remediation efforts vs. goals

Executive Trend Report

Visualize performance trends over time across numerous variables across your website

What Changed Report

Analyze each object to see what was added, changed or moved with side-by-side comparison views

Stop letting active buyers slip through your fingertips