


Quantify by page lost revenue that can be recaptured from removing friction

Visualize step-by-step conversion rates to understand customer fallout and drop-off

Calculate the cost impact on conversions resulting from users being directed to broken links
Identify pages where speed most impacts conversions and prioritize optimization efforts by ROI

Calculate the cost impact on conversions for every first- and third-party tag on your site
Trend, group and analyze side-by-side more than 40 site performance metrics your site vs. competitors

Identify highest converting path and bottlenecks undermining campaign performance

Identify friction points causing Google to deprioritize your site in rankings and customers to bounce prematurely

Identify and address hidden JavaScript functions that cause blocking behavior and frustrate users

Identify pages where speed most impacts conversions and prioritize optimization efforts by ROI

Identify friction caused by every piece of content on your site, to direct remediation efforts

Inventory all 1st & 3rd party domains, create a whitelist of approved domains, auto-generate and deploy your customized CSP

Calculate actual business impact of remediation efforts vs. goals

Visualize performance trends over time across numerous variables across your website

Analyze each object to see what was added, changed or moved with side-by-side comparison views

"No Data" Means that datasets were not collected by Google for this site. The typical reason for this is that the site is blocking Google's Bot ![]() . is a positive delta between this week and last weeks average measurements
. is a positive delta between this week and last weeks average measurements  . is a negative delta between this week and last weeks average measurements.

Picture this: a visitor clicks on your site, ready to learn more, sign up, or make a purchase. But before they can, the page hesitates—an image takes too long to appear, the layout jumps as an ad loads, or a button lags just enough to break the flow. Within seconds, they’re gone.

At Lowe’s, Mike Shady explained how the company built customer loyalty, rung by rung. Each rung represents a step toward loyalty. But as Mike, who led Lowe’s online business, cautioned in this episode of The Frictionless Experience, every step up also carries more risk. "You're climbing rung by rung," Mike said. "You get something that goes bad, do you ever fall one rung down? No. You hit the ground half the time."

The way people shop has changed forever. For millions, the smartphone is the new storefront.

When most people think of Carhartt, they picture rugged workwear built to last: a bib overalls that farmers, ranchers, and tradespeople trust every day. But what's less obvious is that the company's digital presence reflects the same attention to durability and precision.

Imagine watching a customer navigate your website. They pause over a form field, hesitate on a button, and then abandon the page. Every click, every scroll, every hesitation tells a story. But if you’re jumping between tools, it’s easy to miss the plot.

At Microsoft, customer experience (CX) isn’t just about smoothing digital interactions. It’s about creating a movement that employees are proud and even excited to join.

Customer experience leaders live in a paradox. On one hand, executives want proof that CX initiatives will deliver ROI. On the other hand, many of the most meaningful impacts such as loyalty, retention, and revenue growth take years to materialize in the data. That tension can stall progress, create skepticism, and derail transformation efforts.

Struggling to understand why revenue shifts week to week? Most teams can tell you when revenue changes but not why. Traditional analytics stop at surface-level KPIs, leaving you chasing hypotheses, marketing campaigns, or A/B test results that may or may not explain the difference.

When we think about friction in customer journeys, the instinct is often to remove it everywhere. But not all friction is created equal. Some blocks destroy experiences, others simply distract, and some are actually necessary to build trust and protect customers.

After two years and 50 episodes of The Frictionless Experience, we have spoken with more than 40 guests: executives in UX, chief digital officers, marketers, technologists, and product leaders.

In an era where “frictionless” is a rallying cry for every digital team, it’s easy to forget that not all friction is bad. In fact, in financial services—where trust, security, and long-term relationships matter most—the best user experiences aren’t always the ones with the fewest clicks. They’re the ones with the right clicks.

"Magic happens at the intersection of differentiated customer experience, driving business results, using cutting-edge technology," said Sathish Muthukrishnan (Chief Information, Data, and Digital Officer at Ally Bank) on a new episode of The Frictionless Experience.
It's hard to believe it's been five years since we navigated a global pandemic and the basic rules of shopping were turned upside down.

"Frictionless" has become a digital holy grail—especially in financial services. It promises seamless experiences, streamlined transactions, and happy customers.

"Remove all friction" has become a digital mantra, especially in product and customer experience teams. But what if removing all friction isn't actually the goal? What if fraud, not friction, is the enemy?

Online retail moves fast—so keeping systems reliable and running smoothly is more important than ever to provide a frictionless user experience.

Imagine this: It's 2029. A customer just spent $500 with your brand. But they never saw your homepage. Never clicked an ad. Never browsed your site. A chatbot handled the entire transaction in 30 seconds.

MVPs were supposed to be our savior—fast, lean, iterative. But somewhere along the way, they became a trap. What should be a launchpad turns into a support nightmare, eroding trust, frustrating teams, and disappointing customers.
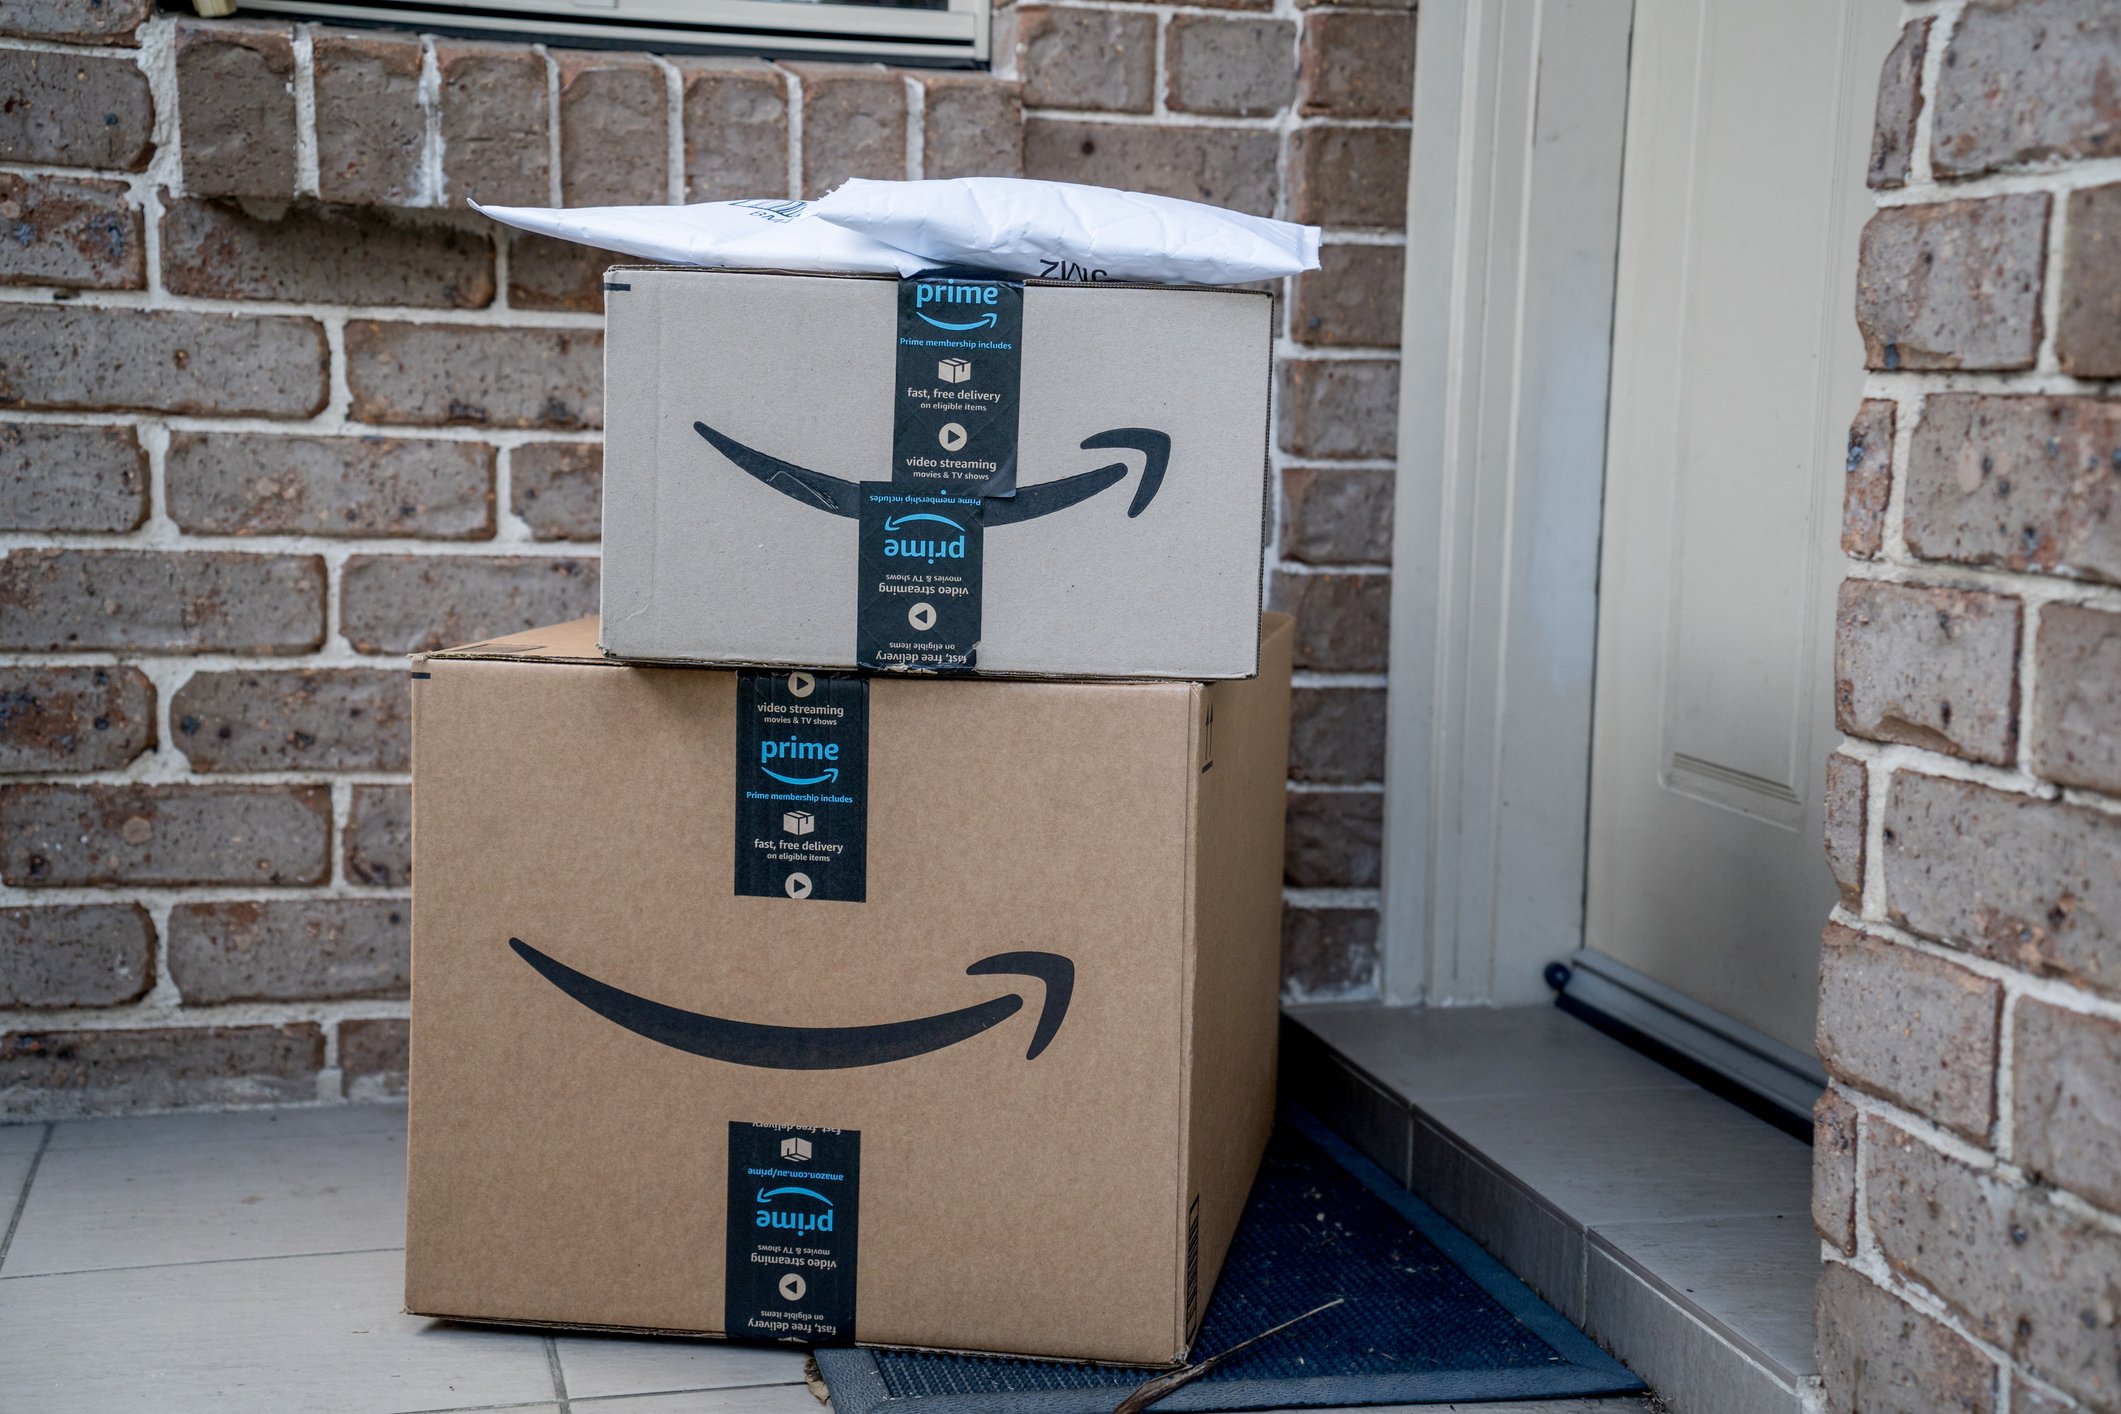
Everyone says they want to be like Amazon. But when something goes wrong, most companies still make the customer jump through hoops.

And why one team bought their own product at a competitor to hit a metric.